
- 223
- 10 118 966
DATAtab
Austria
Приєднався 16 тра 2020
DATAtab - Online Statistics Calculator and e-Learning
DATAtab offers you smart and easy support for your data analysis. It is designed for ease of use and is a compelling free alternative to statistical programs such as SPSS and STATA. On datatab.net data can be statistically evaluated directly online and very easily (e.g. t-test, regression, correlation etc.). DATAtab's wants to make the world of statistical data analysis as simple as possible - without installation and easy to use. Just insert your data into the statistics calculator and select which analyses you want to perform. Create your charts for your data directly online and uncomplicated.
On this youtube channel DATAtab offers more information in form of tutorials and "how to use"-videos. Feel free to subscribe, like and discuss!
Statistics - A Full Lecture to learn Data Science
Welcome to our full and free tutorial about statistics (Full-Lecture). We will uncover the tools and techniques that help us make sense of data. This video is designed to guide you through the fundamental concepts and some of the most powerful statistical tests used in research today. From the basics of descriptive statistics to the complexities of regression and beyond, we'll explore how each method fits into the bigger picture of data analysis.
► EBOOK
datatab.net/statistics-book
► Statistics Calculator
datatab.net/statistics-calculator/descriptive-statistics
► Tutorials
datatab.net/tutorial/descriptive-inferential-statistics
0:00 Intro
1:25 Basics of Statistics
21:29 Level of Measurement
34:26 t-Test
50:53 ANOVA (Analysis of Variance)
59:55 Two-Way ANOVA
1:16:47 Repeated Measures ANOVA
1:31:15 Mixed-Model ANOVA
1:42:56 Parametric and non parametric tests
1:50:37 Test for normality
1:58:41 Levene's test for equality of variances
2:02:54 Non-parametric Tests
2:03:29 Mann-Whitney U-Test
2:11:46 Wilcoxon signed-rank test
2:22:03 Kruskal-Wallis-Test
2:32:01 Friedman Test
2:42:30 Chi-Square test
2:53:02 Correlation Analysis
3:20:19 Regression Analysis
4:06:45 k-means clustering
Переглядів: 280 742
Відео


Levels of Measurement - Nominal, Ordinal, Interval and Ratio
Переглядів 4,7 тис.2 місяці тому
In this video, we're going to explore the four levels of measurement-Nominal, Ordinal, Interval, and Ratio. Each level gives us important information about the variable and supports different types of statistical analysis. ► Statistics Calculator datatab.net/statistics-calculator/descriptive-statistics ► EBOOK datatab.net/statistics-book ► Tutorial datatab.net/tutorial/level-of-measurement 0:00...
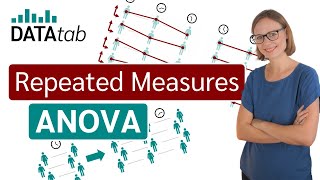
Repeated Measures ANOVA (Analysis of Variance) - Simply explained
Переглядів 8 тис.2 місяці тому
This video is about repeated measures ANOVA (Analysis of Variance), we go through the following questions: What is repeated measures analysis of variance? What are the hypotheses and assumptions? How is an analysis of variance with repeated measures calculated? How are the results interpreted? What is a post hoc test and how do I interpret it correctly? An analysis of variance with repeated mea...
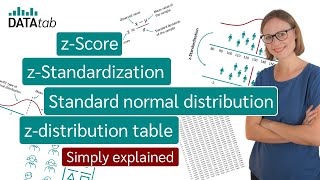
z-Score, z-Standardization, Standard Normal Distribution, z-Distribution Table - Simply explained
Переглядів 14 тис.3 місяці тому
In this video, we discuss what the z-Score is, how z-standardisation (z-transformation) works and what the standard normal distribution is. I will also show you what the z-distribution table (standard normal distribution table) is and what you need it for. For a better understanding, let's go through the individual points using a simple example. ► EBOOK datatab.net/statistics-book ► z-distribut...

What is the difference between parametric and nonparametric hypothesis testing?
Переглядів 10 тис.3 місяці тому
Hi, in this video I explain the difference between parametric and non-parametric tests! You want to calculate a hypothesis test, but don't know exactly what the difference is between a parametric and non-parametric test and are wondering when to use which test. If you want to calculate a hypothesis test, you must first check the assumptions for the respective hypothesis test. One of the most co...

What is Descriptive Statistics? A Beginner's Guide to Descriptive Statistics!
Переглядів 6 тис.3 місяці тому
Descriptive statistics is a branch of statistics that involves summarizing and organizing data in a way that it can be easily understood. This statistical method focuses on describing and understanding the features of a specific data set by providing summaries about the sample and measures of the data. The main goal is to present a large amount of data in a clear and concise manner for easy int...
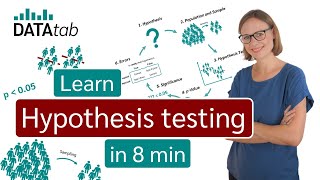
What is a hypothesis test? A beginner's guide to hypothesis testing!
Переглядів 10 тис.4 місяці тому
Hypothesis testing is used to determine whether there is enough evidence in a sample of data to infer that a certain condition is true for the entire population. Therefore, it's a method to test an assumption or theory about a parameter of a population based on a sample. ► Hypothesis test calculator datatab.net/statistics-calculator/hypothesis-test ► EBOOK datatab.net/statistics-book ► Tutorial...

What is Statistics? A Beginner's Guide to Statistics (Data Analytics)!
Переглядів 12 тис.4 місяці тому
If you want to finally understand statistics, this is the place to be! After this video, you will know what statistics is, what descriptive statistics is and what inferential statistics is. Statistics is the science of collecting, analyzing, interpreting, and presenting data. Statistics is integral to various fields, including business, economics, engineering, medicine, social sciences, and nat...

Fractional Factorial Design (DoE) Simply explained
Переглядів 6 тис.4 місяці тому
What is a Fractional Factorial Design? A fractional factorial design is a type of experimental design used to analyse the effects of several factors (or variables) on a response variable. What is the difference with a full factorial design? In a full factorial design, every possible combination of factor levels is examined. Conversely, a fractional factorial design strategically excludes certai...
Between-Subject Design vs. Within-Subject Design
Переглядів 3,2 тис.4 місяці тому
What is the difference between a Between-subject Design and a Within-subject Design? And why is it important to know the difference? This is what we discuss in this video! ► Hypothesis test calculator datatab.net/statistics-calculator/hypothesis-test ► EBOOK datatab.net/statistics-book ► Example data datatab.net/statistics-calculator/hypothesis-test/mixed-model-anova-calculator?example=two_fact...
Mixed Model ANOVA (Analysis of Variance) Simply explained
Переглядів 7 тис.4 місяці тому
What is a Mixed Model ANOVA? What are the hypotheses and assumptions? And how to interpret the results of a Mixed Model ANOVA? This is what we discuss in this video! A Mixed Model ANOVA is a statistical method used to analyze data that involve both between-subjects factors and within-subjects factors. ► Mixed Model ANOVA example data datatab.net/statistics-calculator/hypothesis-test/mixed-model...
Full Factorial Design (DoE - Design of Experiments) Simply explained
Переглядів 9 тис.5 місяців тому
In this video, we discuss what a full factorial design is, how to create it and how to analyze the results obtained. A full factorial design is a systematic method for examining the effects and possible interactions of multiple factors on a response variable. ► Full Factorial Design DoE Calculator datatab.net/statistics-calculator/design-of-experiments/full-factorial-design-calculator ► EBOOK d...
Design of Experiments (DoE) simply explained
Переглядів 28 тис.5 місяців тому
In this video, we discuss what Design of Experiments (DoE) is. We go through the most important process steps in a DoE project and discuss how a DoE helps you to reduce the number of experiments. We then discuss how you can estimate the number of experiments needed and we go through the most common experimental designs: Full factorial design, Fractional factorial design, Plackett-Burman Design,...
Simple linear Regression, Multiple linear Regression and Logistic Regression - Regression Analysis
Переглядів 12 тис.7 місяців тому
In this video I will explain regression analysis to you in a simple way. First you will learn what regression is and what it is used for, then we will look at the difference between simple linear regression, multiple linear regression and logistic regression. Finally, we will calculate a real world example, we will analyse the housing market and I will show you how to interpret the results usin...
What is inferential statistics? Explained in 6 simple Steps.
Переглядів 26 тис.7 місяців тому
In this video we are gone talk about what inferential statistics does in 6 simple steps (Hypothesis, Population and Sample, Hypothesis Testing, p-Value, Statistical Significance, Errors). But, what is inferential statistics? Inferential statistics allows us to make conclusions or inferences about a population based on data from a sample. ► Inferential Statistics Calculator datatab.net/statistic...
Two-Way ANOVA - all Equations - calculated by Hand
Переглядів 13 тис.7 місяців тому
Two-Way ANOVA - all Equations - calculated by Hand
Standard Deviation, Variance, Range and Interquartile Range - Measures of dispersion
Переглядів 3,8 тис.7 місяців тому
Standard Deviation, Variance, Range and Interquartile Range - Measures of dispersion
Mean, Median and Mode - Measures of Central Tendency
Переглядів 4,6 тис.7 місяців тому
Mean, Median and Mode - Measures of Central Tendency
Descriptive Statistics [Simply explained]
Переглядів 49 тис.7 місяців тому
Descriptive Statistics [Simply explained]
How to calculate a Chi-Square Test?
Переглядів 4,2 тис.7 місяців тому
How to calculate a Chi-Square Test?
What is a Raincloud Plot? [Simply explained]
Переглядів 2 тис.7 місяців тому
What is a Raincloud Plot? [Simply explained]
Bland-Altman Plot [Simply explained]
Переглядів 16 тис.8 місяців тому
Bland-Altman Plot [Simply explained]
What are the assumptions of a Two-Way ANOVA?
Переглядів 2,2 тис.8 місяців тому
What are the assumptions of a Two-Way ANOVA?
What are the hypotheses of the t-test (Null & alternative hypothesis)?
Переглядів 1,8 тис.8 місяців тому
What are the hypotheses of the t-test (Null & alternative hypothesis)?
How to report an Paired Samples t-Test?
Переглядів 6 тис.8 місяців тому
How to report an Paired Samples t-Test?
How to report an Independent Samples t-Test?
Переглядів 5 тис.8 місяців тому
How to report an Independent Samples t-Test?
How to report a Wilcoxon signed rank test?
Переглядів 5 тис.8 місяців тому
How to report a Wilcoxon signed rank test?
How to report a Mann-Whitney U Test?
Переглядів 6 тис.9 місяців тому
How to report a Mann-Whitney U Test?
Worst background speech ever. It feels like someone is honking at you constantly by your ears.
The most useless plot ever, why not just a box plot and a histogram lol But you do you
Thank you for market basket analysis knowledge. Then you could make simple explanation.
best for priming.
But this test has a table. Why did not you use table?
French translate please
Anybody who understands better to explain please😢
no closed captions?
what would be the counterpart of this test for not normally distributed data?
Gut❤
Fantastic presentation
thank you for this
Thank you for the explanation and examples! It has been some time I didn't calculate Chronbach's a, so I forgot the way it works. That was clear and to the point.
An excellent presentation!
This is the best explanation I’ve ever come across… I’ve even published research papers using t test but this really deepened my understanding
Very useful explanation. You are skilled. Perfect
youre better than my teacher omg thank you
such a very good vidio. Thank u so much for your explanation
Thnq very much ❤
This is a very clear and easy explanation of standard deviation.thanks
I jus finished my exams ion ever wanna see t tests ever again in my LIFE
I love you teaching style 😢🎉❤
Great explanation
Good explanation
Very informative Much appreciated work Keep it up
Thank you very nicely explained
Excellent, wonderful and easy to use explanation. Congrats!!
I'm sorry to say it but your voice makes me feel sleepy.
Thank u my friend From GREAT OROMIA ETHIOPIA 🇪🇹 💖 💓
10:30
Explained in a very simple and understandable manner 👍🏻
This is very helpful -sir adib student
You should do one course for how to use Stats in Finance & specially in understanding markets.
Vielen Dank!
Explained Brilliantly!!! Keep it up!
❤
this method can be applied to retail to predict when a client will purchase again a determined product?
Wo kommt denn die beobachtete Häufigkeit her? Ich verstehe ab da nichts mehr und muss eine Statistik Klausur bestehen.
thanks you so much that was magnificent!!!!
Thank you for your explanation. Very very helpful!
Your explanation is a very helpful for me to understand my statistics class. Thank you!
I'm taking Statistics for Businesses class. This is very helpful. Thanks a lot. 🫡
This is the most boring, but important, topic
English from babble
Thank you very much! Thank you for your great explanation.
my dependent variable is not normal. so, what check I should choose? Please reply
When you have exam and you don't remember what your professor said ...
😅 . 😅😮 54 😅 😢 5 P😅🎉l.¡j oo Gyu0you .c00lpo ውቬ😅 ፊፊ🎉ዠዐሐሐሐሐደደደ🎉ሐደሐደደደደሐደደሐደሒሐሐደሐሐሐሐሐሐሐ 🎉🎉🎉🎉🎉🎉
1:18:00
well explained